⚡ Electricity Prices in Switzerland 2026: Everything You Need to Know
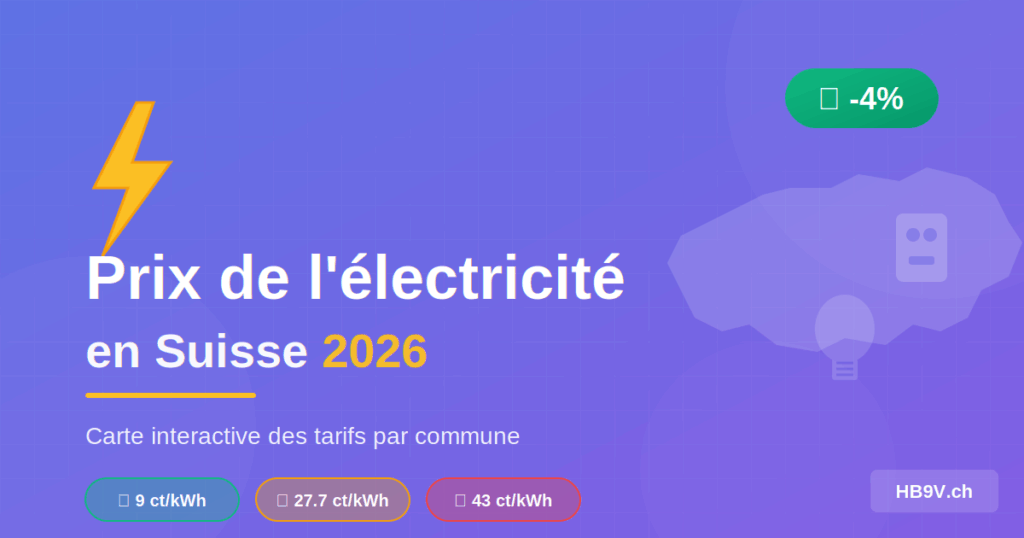
Good news for radio amateurs and all Swiss consumers! Electricity rates are falling by an average of 4% in 2026. Find out the prices in your municipality with our interactive map, understand your bill and optimise your shack's consumption. This complete guide gives you everything you need to keep your energy costs under control.
🗺️ Quick access to the interactive map: Check electricity prices by municipality directly from the site menu: Tools → Electricity prices, or go straight to the interactive map page.
📊 Key Figures for 2026
The Federal Electricity Commission (ElCom) has published the rates for 2026. Here are the main statistics to remember for a typical household using 4,500 kWh a year (H4 profile).
🏆 Cheapest municipality
9.05 ct/kWhZwischenbergen (VS)
About 3× cheaper than the Swiss average!
Thanks to local hydroelectric production
💸 Most expensive municipality
43.61 ct/kWhKestenholz (SO)
Almost 5× more expensive than Zwischenbergen!
A gap of 34.56 ct/kWh between the extremes
📈 Notable Changes by Region
Price changes are not uniform across the country. Some municipalities will see their bills fall significantly, while others face increases.
-15% (Viteos)
Record decrease in French-speaking Switzerland
-12% (SiL)
Good news for Vaud residents
-33% (SAK)
The biggest decrease in Switzerland!
-15% (Viteos)
Back to Groupe E levels
-1% to -3% (SIG)
Modest change
+18%
Exceptional increase
💡 Why these decreases? The easing of rates is mainly due to falling energy prices on the European markets. Many supply contracts signed in 2022-2023 at exceptionally high prices are expiring, allowing suppliers to buy on better terms.
🗺️ Interactive Map of Prices by Municipality
Find out the price of electricity in your municipality with our interactive map. Filter by canton, price level or supplier to quickly find the information you are interested in.
🗺️ View the Interactive Map
See the 2026 rates for more than 700 Swiss municipalities, with filters by canton, price and supplier.
⚡ See the Price MapAlso available from the menu: Tools → Electricity prices
🎨 Map key
- ● Green: low price (< 25 ct/kWh), good-value municipalities
- ● Orange: medium price (25-32 ct/kWh), around the Swiss average
- ● Red: high price (> 32 ct/kWh), more expensive municipalities
Features: search by municipality name, filters by canton and price level, dynamic statistics, detailed popup with a breakdown of the rate.
🏔️ The 10 Cheapest Municipalities in Switzerland
Valais dominates this ranking by far, thanks to its abundant local hydroelectric production.
| Rank | Municipality | Canton | 2026 price | Supplier |
|---|---|---|---|---|
| 🥇 1 | Zwischenbergen | VS | 9.05 ct/kWh | EWZ Zwischenbergen |
| 🥈 2 | Savièse | VS | ~10 ct/kWh | ESR |
| 🥉 3 | Naters | VS | ~10.5 ct/kWh | EnAlpin |
| 4 | Vollèges | VS | ~11 ct/kWh | FMV |
| 5 | Finhaut | VS | ~12.5 ct/kWh | FMV |
| 6 | Bourg-Saint-Pierre | VS | ~13 ct/kWh | FMV |
| 7 | Orsières | VS | ~14 ct/kWh | FMV |
| 8 | Liddes | VS | ~15 ct/kWh | FMV |
| 9 | Sembrancher | VS | ~16 ct/kWh | FMV |
| 10 | Bagnes | VS | ~17 ct/kWh | FMV |
💡 Why is Valais so cheap? The canton has substantial local hydroelectric production. Municipalities that own their own dams or power stations can offer very competitive rates to their residents, as they do not depend on buying on the market.
💸 The Most Expensive Municipalities
| Rank | Municipality | Canton | 2026 price | Supplier |
|---|---|---|---|---|
| 1 | Kestenholz | SO | 43.61 ct/kWh | AEK |
| 2 | Trimbach | SO | ~38 ct/kWh | AEK |
| 3 | Langendorf | SO | ~37.5 ct/kWh | AEK |
| 4 | Gretzenbach | SO | ~37 ct/kWh | AEK |
| 5 | Sissach | BL | ~35 ct/kWh | EBL |
⚠️ Note: Municipalities in Solothurn (SO) and Basel-Landschaft (BL) are among the most expensive in Switzerland. If you live there, it is all the more important to optimise your electricity consumption.
📻 Impact for Radio Amateurs
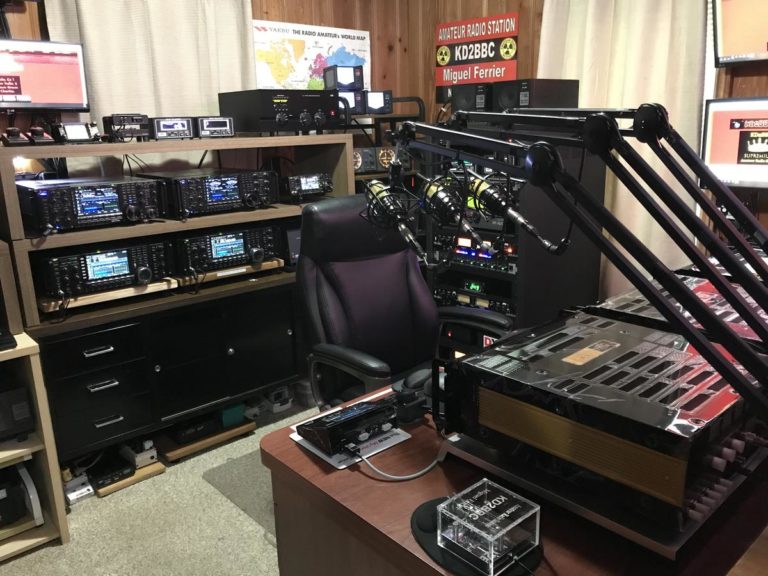
As a radio amateur, your electricity consumption can be significant, especially if you regularly operate with power amplifiers or equipment left permanently on standby.
📡 Consumption of a Typical Shack
100W HF transceiver: 200-300W at the PA
1kW linear amplifier: 1500-2000W
Power supply + accessories: 50-100W
Computer + screens: 100-300W
Total when transmitting: 400W to 2500W
💰 Cost Estimates
1-hour QSO at 100W:
~8 ct (average price 27.7 ct/kWh)
24h contest with an amplifier:
~CHF 10-15 of electricity
MMDVM hotspot 24/7:
~CHF 5-10/month
🔌 Equipment on Standby
Switch-mode power supply: 5-15W
Network router/switch: 10-20W
Pi-Star/WPSD hotspot: 3-5W
SDR receiver: 5-10W
24/7 standby: CHF 20-50/year
💡 Saving Tips
• Switch off equipment you are not using
• Use power strips with a switch
• Choose efficient power supplies (80+)
• Schedule equipment standby
• Monitor consumption with a power meter
✅ OM tip: Invest in a plug-in power meter (Kill-A-Watt type) to measure the real consumption of your shack. You may be surprised by how much some equipment draws on standby! A valve linear amplifier can use 100-200W just on standby.
🧮 Calculate your consumption! Use our Electricity Consumption Calculator to estimate the annual cost of your shack accurately. Select your equipment (transceiver, amplifier, PC, hotspot...) and get a personalised estimate based on the price in your municipality.
📝 Understanding Your Electricity Bill
The price of electricity is made up of several components. Understanding this structure helps you analyse your bill better.
🧾 Breakdown of the electricity price
| Component | Average share | Description |
|---|---|---|
| ⚡ Energy | ~38% | Cost of producing or buying electricity on the market |
| 🔌 Grid | ~42% | Transmission and distribution (lines, transformers, maintenance) |
| 💰 Taxes and levies | ~20% | Federal surcharge, municipal taxes, winter reserve |
New in 2026: A new metering charge appears on bills (approx. CHF 6-8/month) to cover the cost of rolling out smart meters.
📊 H4 Consumption Profile
The statistics presented in this article and on the interactive map are based on the H4 profile, which corresponds to a typical household:
- Home: 5-room flat or house
- Appliances: electric cooker, washing machine, tumble dryer, dishwasher
- Annual consumption: 4,500 kWh
- No electric heating (otherwise profiles H5-H8)
If your consumption differs significantly (very active shack, electric heating, etc.), your actual bill may vary.
📉 Price History: Some Perspective
To understand how rates have changed, here is an overview of recent years:
| Year | Average price | Change | Context |
|---|---|---|---|
| 2022 | 21 ct/kWh | - | Last “normal” year before the crisis |
| 2023 | 27 ct/kWh | +27% | Energy crisis following the war in Ukraine |
| 2024 | 32 ct/kWh | +18% | Impact of the 2022-2023 contracts |
| 2025 | 29 ct/kWh | -10% | Start of the easing |
| 2026 | 27.7 ct/kWh | -4% | Further decrease |
⚠️ Note: Despite the decreases in 2025 and 2026, prices remain 32% higher than in 2022. A return to pre-crisis levels is not expected in the short term, given the investment needed in the grids and in renewable energy.
🔮 Outlook for the Future
📈 Factors that could push prices up
- Investment in the grid (smart grid)
- Development of renewable energy
- Cost of the winter reserve
- Roll-out of smart meters
- Geopolitical tensions on the markets
📉 Factors that could push prices down
- Stabilisation of the European markets
- Increased renewable production
- End of the expensive 2022-2023 contracts
- Greater energy efficiency
- New storage capacity
🔗 Sources and Resources
📚 Official sources
- ElCom: electricity prices: official website with full data by municipality
- RTS Info: detailed article on the 2026 rates
- opendata.swiss: ElCom open data
🛠️ Useful tools
- HB9V interactive map: view prices by municipality
Menu: Tools → Electricity prices - Consumption calculator: estimate the electricity cost of your shack
Menu: Tools → Consumption calculator
🗺️ Find Out the Price in Your Municipality
Use our interactive map to find the exact electricity rate in your municipality and compare it with your neighbours.
⚡ View the Interactive MapMenu: Tools → Electricity prices
🧮 Calculate Your Shack's Consumption
Estimate the annual electricity cost of your radio station: transceiver, amplifier, PC, MMDVM hotspot and all your equipment.
⚡ Go to the CalculatorMenu: Tools → Consumption calculator
❓ Frequently Asked Questions
❓ Can I change supplier?
In Switzerland, only large consumers (>100,000 kWh/year) can choose their supplier. Households receive “basic supply” from the local grid operator, so you cannot change supplier.
❓ Why such large differences?
The differences are explained by the supplier's procurement strategy, local (hydroelectric) production, investment in the grid and municipal taxes. Some suppliers bought on the market at the wrong time.
❓ How can I reduce my bill?
Save energy (LEDs, A+++ appliances, standby), install solar panels if possible, optimise your tariff (single/dual rate) and monitor your consumption with a smart meter.
❓ Will prices keep falling?
Probably not significantly. 2026 prices represent a “new normal” higher than before 2022. Investment in the grid and in renewables will keep rates at these levels.